
How many hectares of the total arable land over an area is under the cultivation of a particular crop such as sugar beet?
In today’s world of agriculture, we can use data tools to prepare databases and lead our strategic planning with better, more precise estimations of yield & production needs.
Identifying a crop type in a geographical area and estimating the area under cultivation of that particular crop is a relatively complex and less-performed process that only becomes possible through many satellite images, statistical and mathematical analysis of these images and the use of artificial intelligence and machine learning. It should be noted that the main challenge is to collect the required field data and evaluate the accuracy of the system designed for this purpose.
«How much» of «Which crop»?!
The crop mapping product prepares an inventory of what was grown in certain areas and when. Using this service, the type of crop under cultivation and its area (hectares) can be identified in any field and the planting/harvest dates can be planned based on the type of crop. In addition, it is possible to check what changes have taken place in any particular field during the previous seasons. It is also possible to obtain farm sizes and crop information for different regions and compare the production level of hundreds of farms of the same crop in a single software environment. This system is designed to detect a specific crop such as sugar beet, corn, alfalfa, rapeseed, wheat and barley based on measurable and comparable parameters within the geographical map of a region or province, and estimate total area under cultivation of that crop with an acceptable approximation.
Users of this type of data
Crop area estimates are especially important in measuring production changes over long periods of time. The use of this type of monitoring in the pre-full growth stage of the plants will help in more accurate estimation that will lead to better evaluation and forecasting, and will also play an important role in major decisions regarding the import and export of such products. On the other hand, identifying the agricultural lands under cultivation of a crop is effective for the fair distribution of agricultural inputs to farmers. Such a map provides good insights for investors, consultants, suppliers, insurance companies and governments into local and national trends in specific crop production. It helps predict market performance at all levels and makes smart decisions at the macro level.
Our experience in the field
Implementing such a system is one of the custom services that our team (Cropinno) offers today based on the knowledge & experience we have gained in the field. The crop mapping service is an infrastructure that can be used by agro-industries, factories, rural cooperatives and government agencies to identify and estimate the production level of strategic crops.
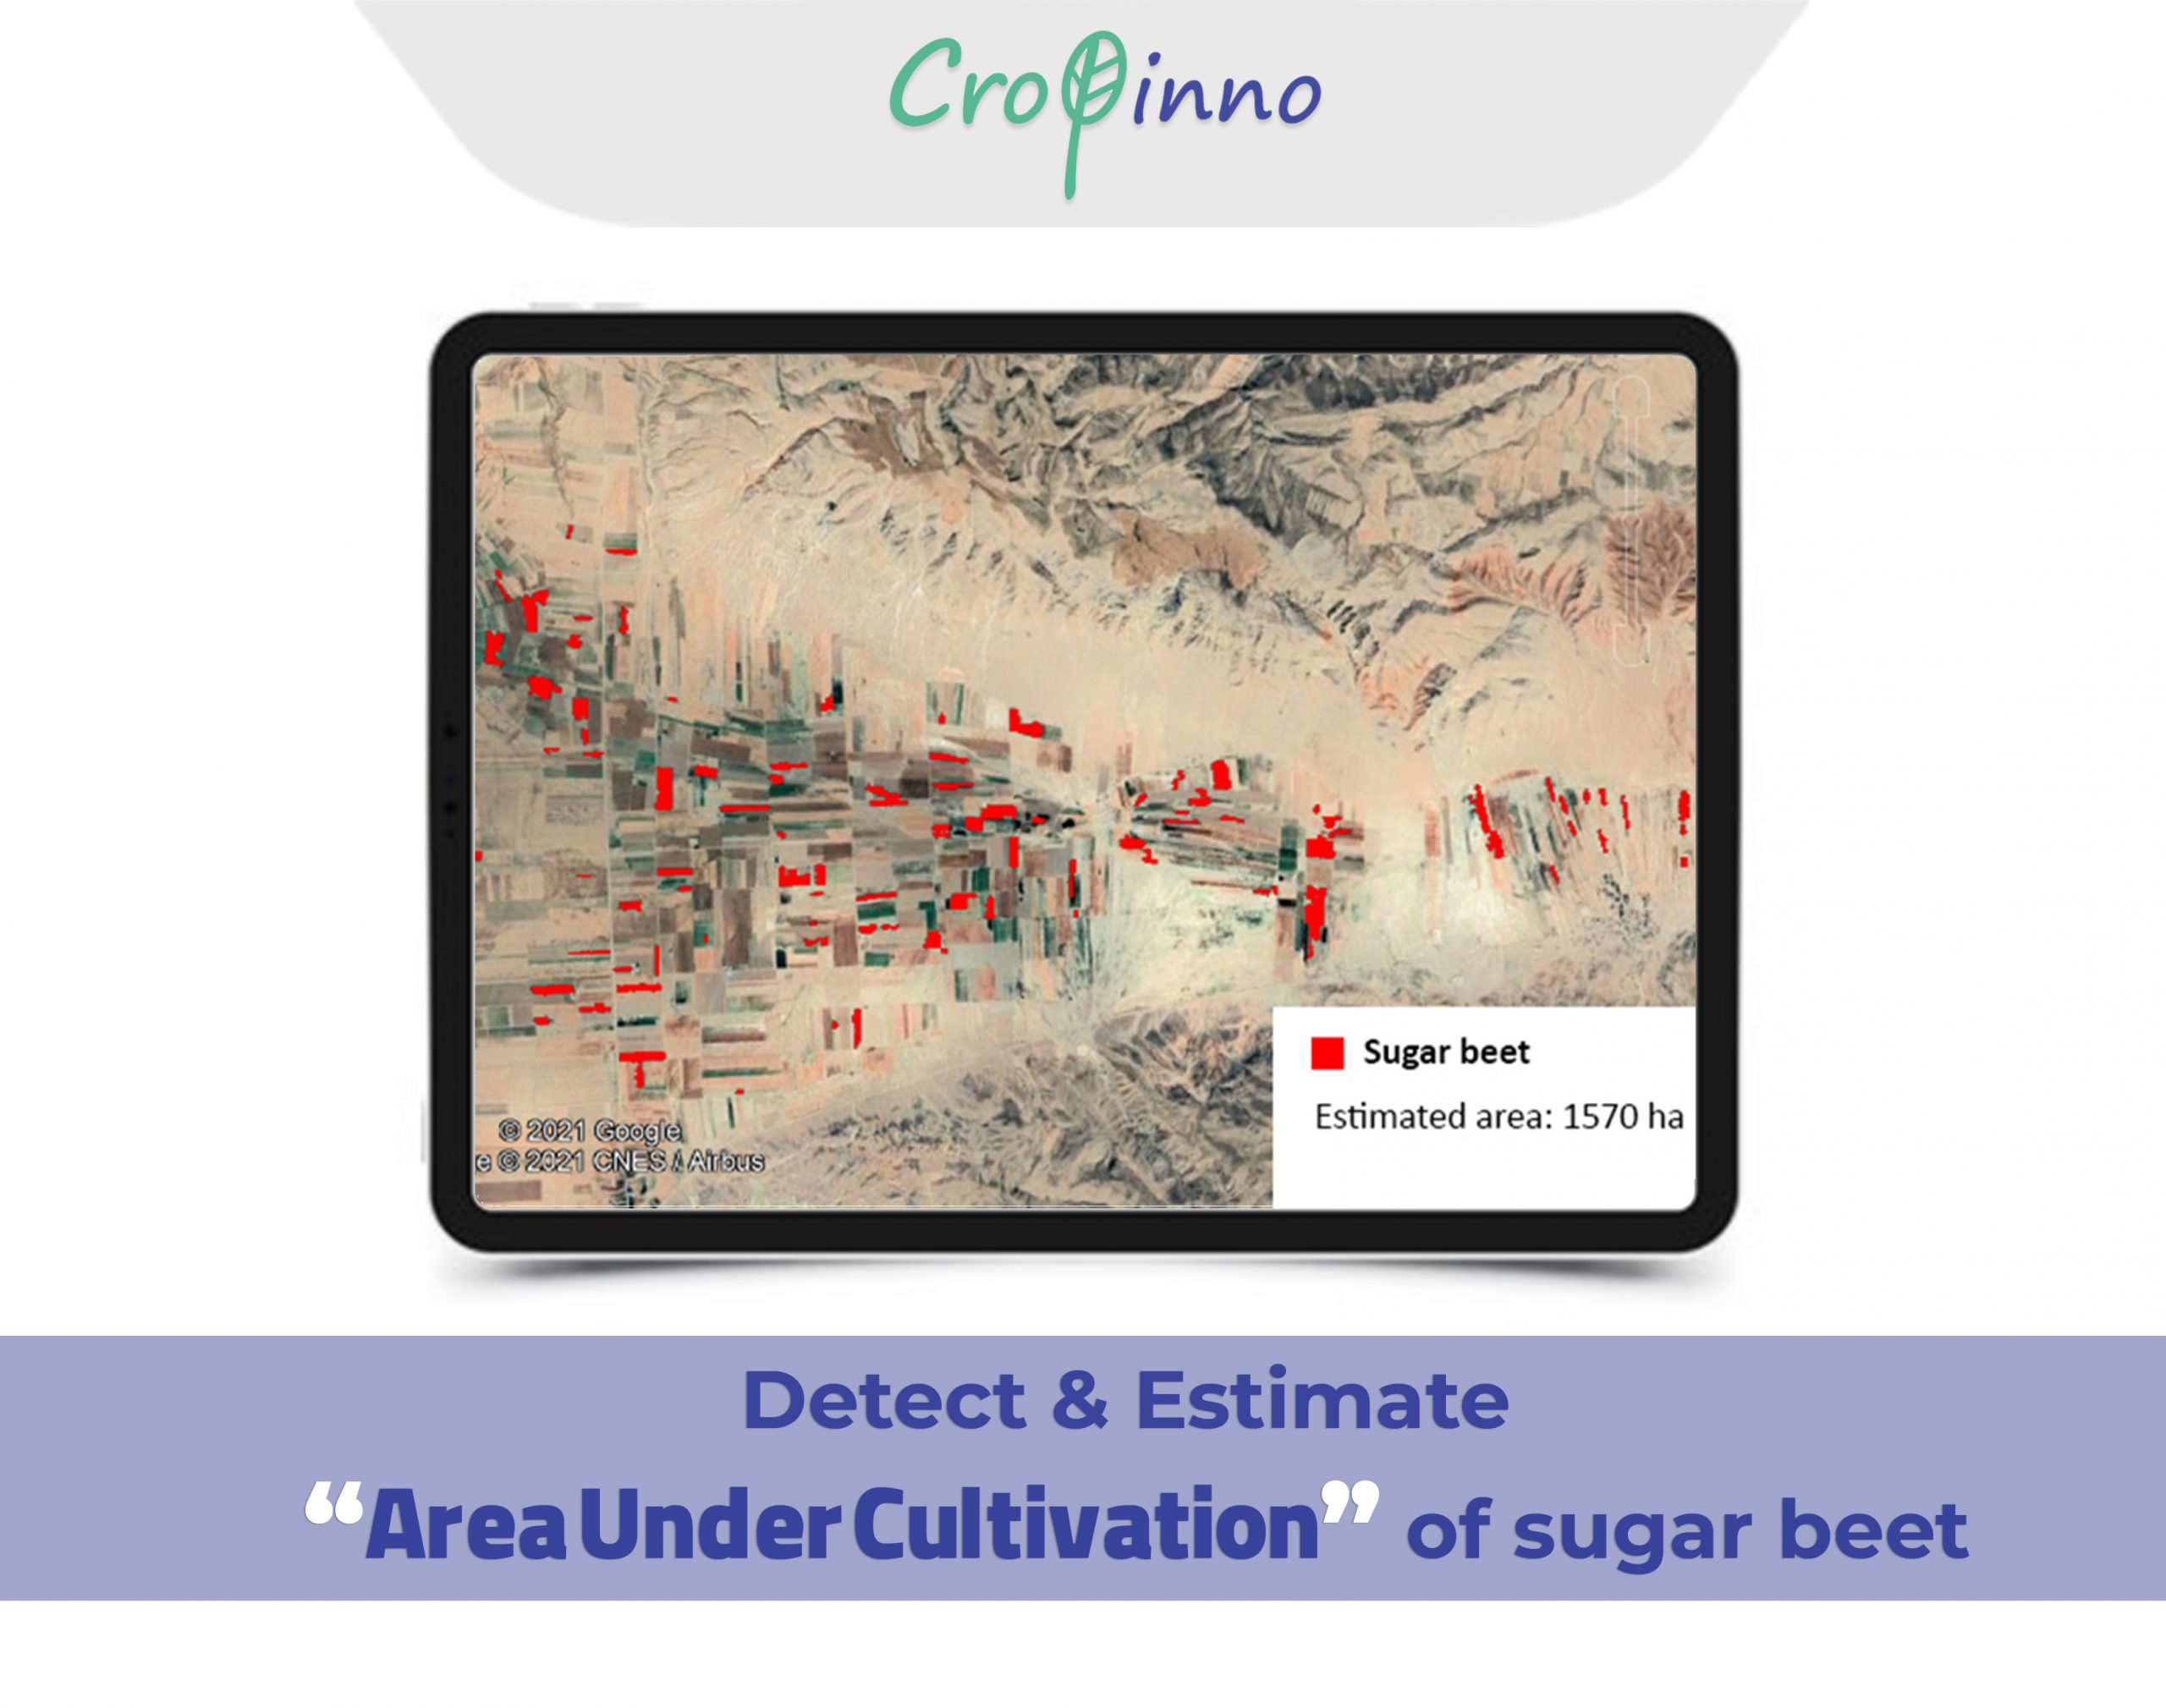
As a successful implemented example, Cropinno was able to calculate the area under sugar beet cultivation in 4 adjacent cities. According to the previous studies, the total area of monitored agricultural land in that region was about 260,000 hectares, after which the area under sugar beet cultivation was identified and segregated from this total area.