Today, the space industry & its applications have found a significant role in many aspects of human life. The field of agriculture has also made significant progress due to the facilities and possibilities provided by satellites. Satellites equipped with remote-sensing abilities fly over any part of the earth at regular intervals, and by sending specific frequencies to the earth and receiving its feedback, they obtain accurate information about what is happening on the surface of the earth. Transforming this raw information into practical data for agriculture requires the design and development of softwares such as Cropinno that can create comprehensible data, graphs and charts by analyzing and comparing the information. The job of such software is to turn satellite information into something user-friendly, so that farmers, farm owners, agricultural consultants, and suppliers can use it to continuously monitor land and make better short-term and long-term decisions.
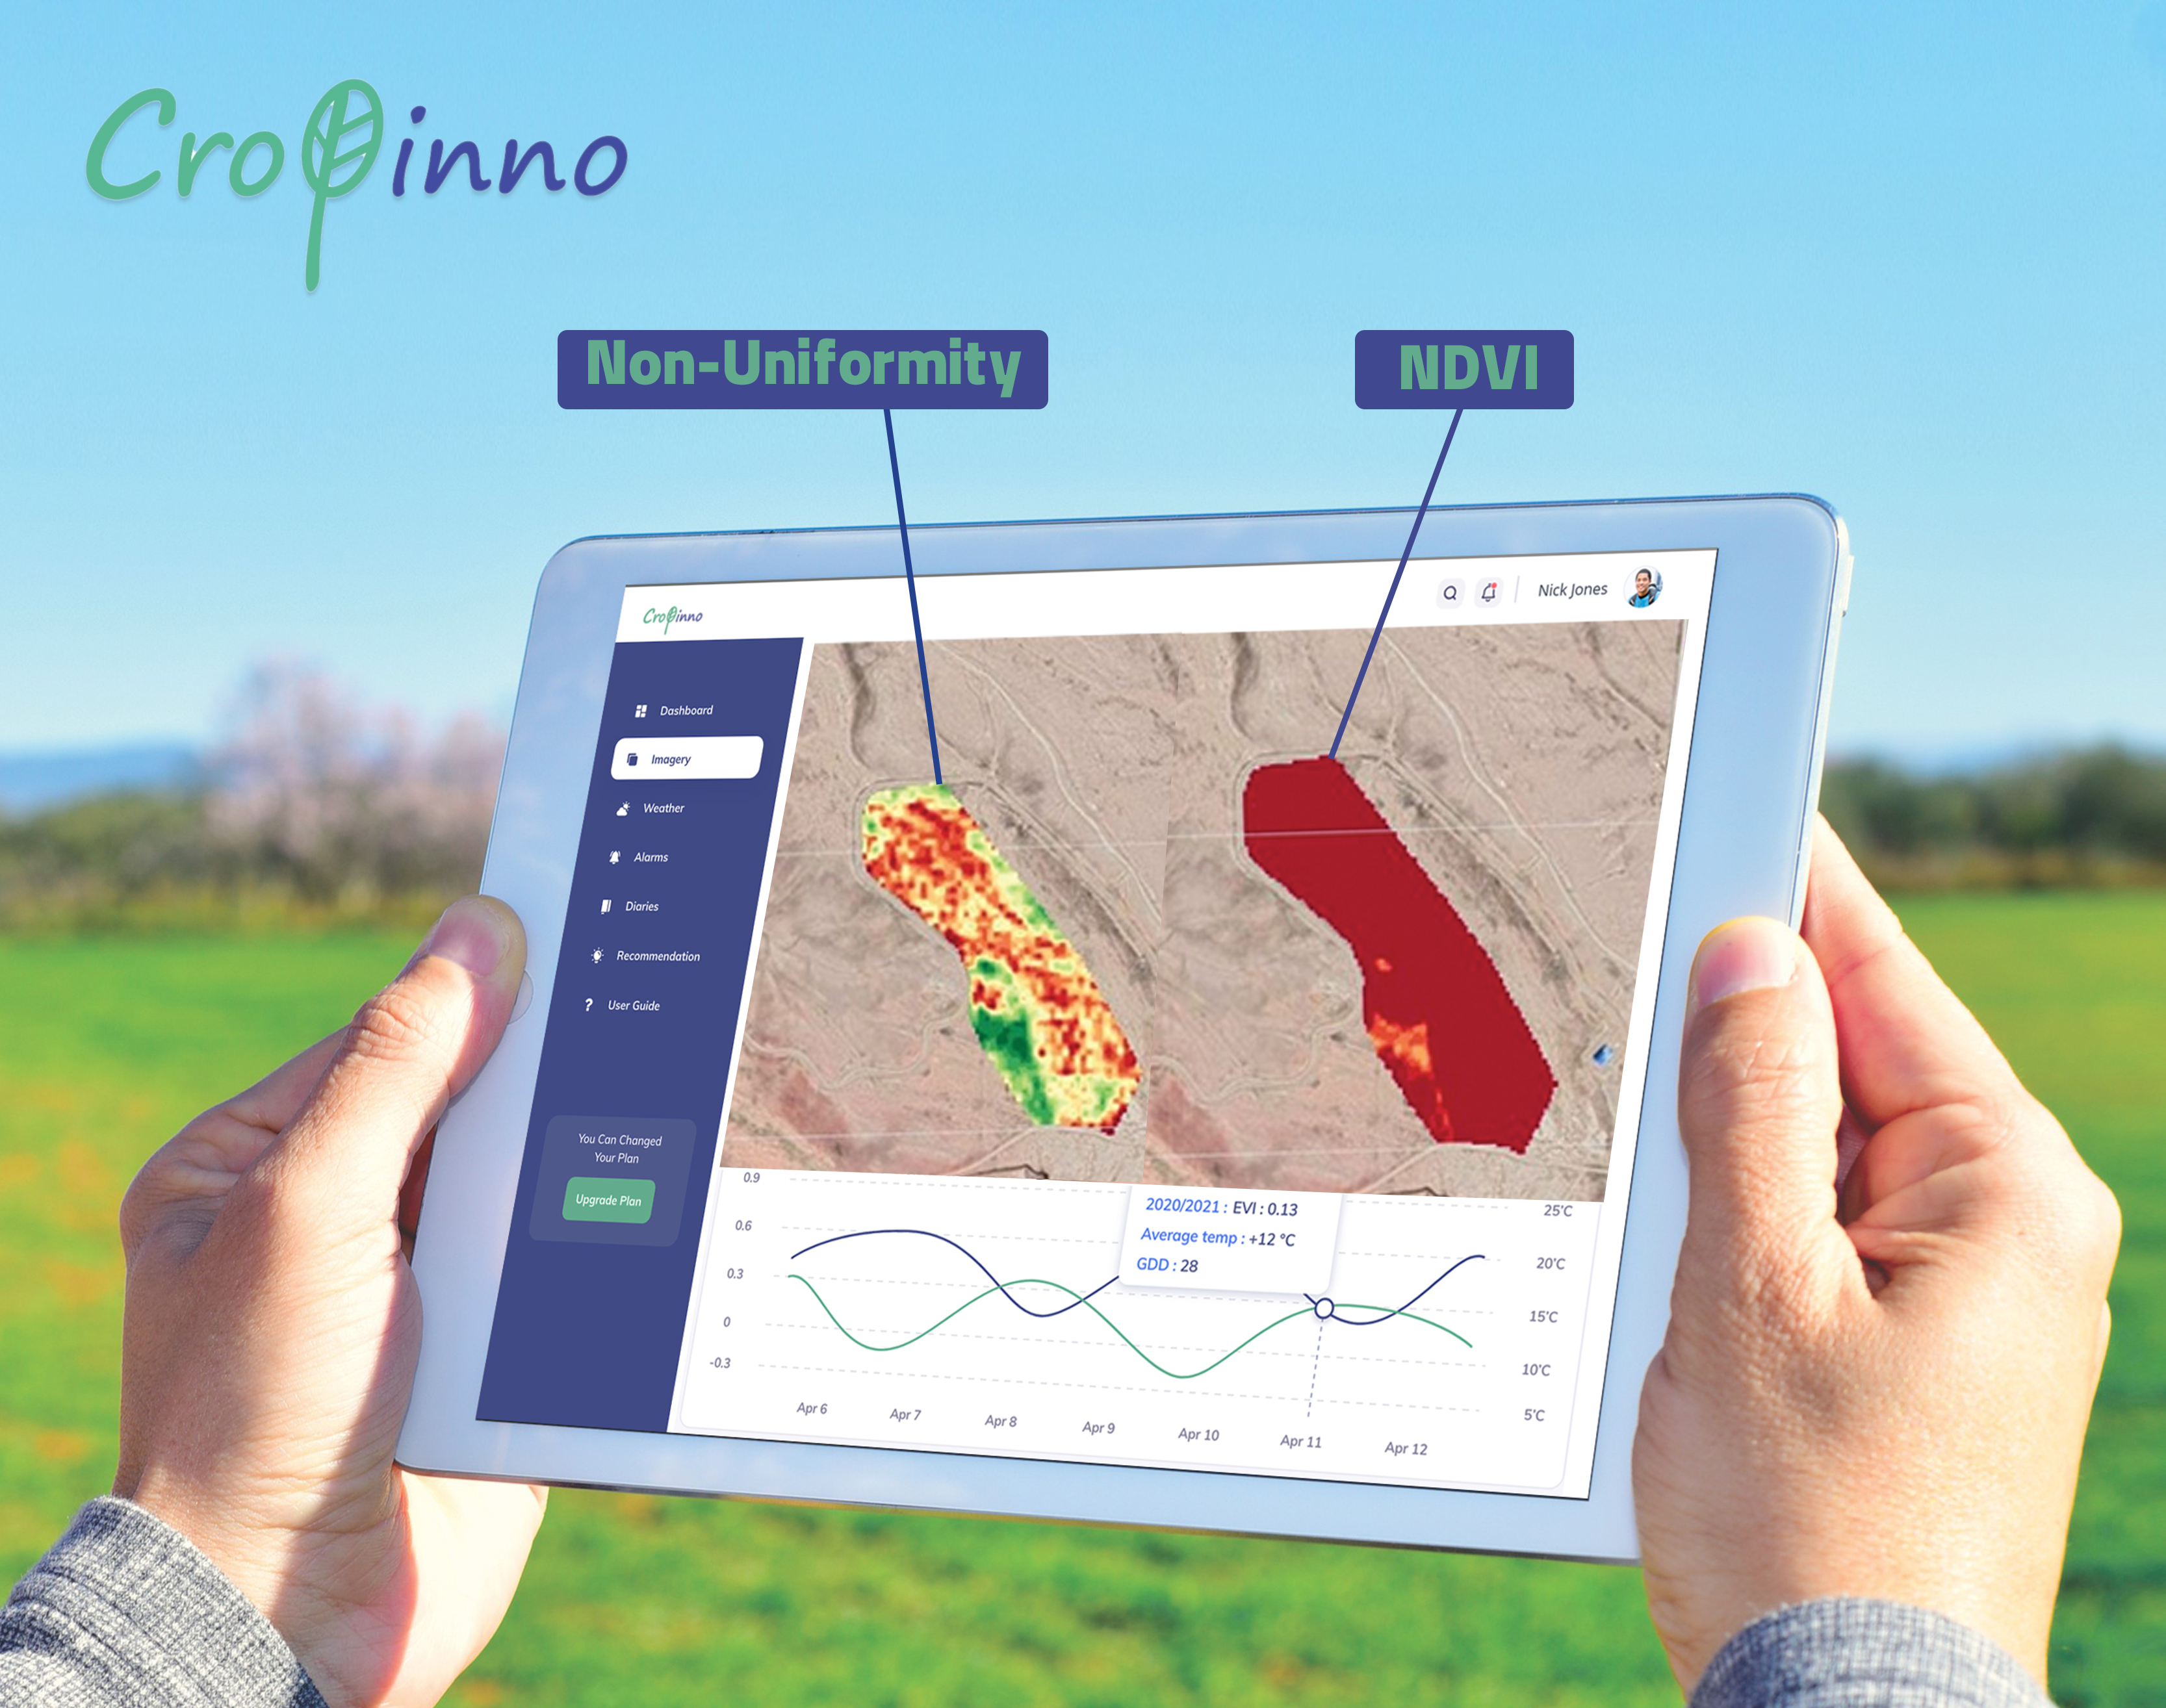
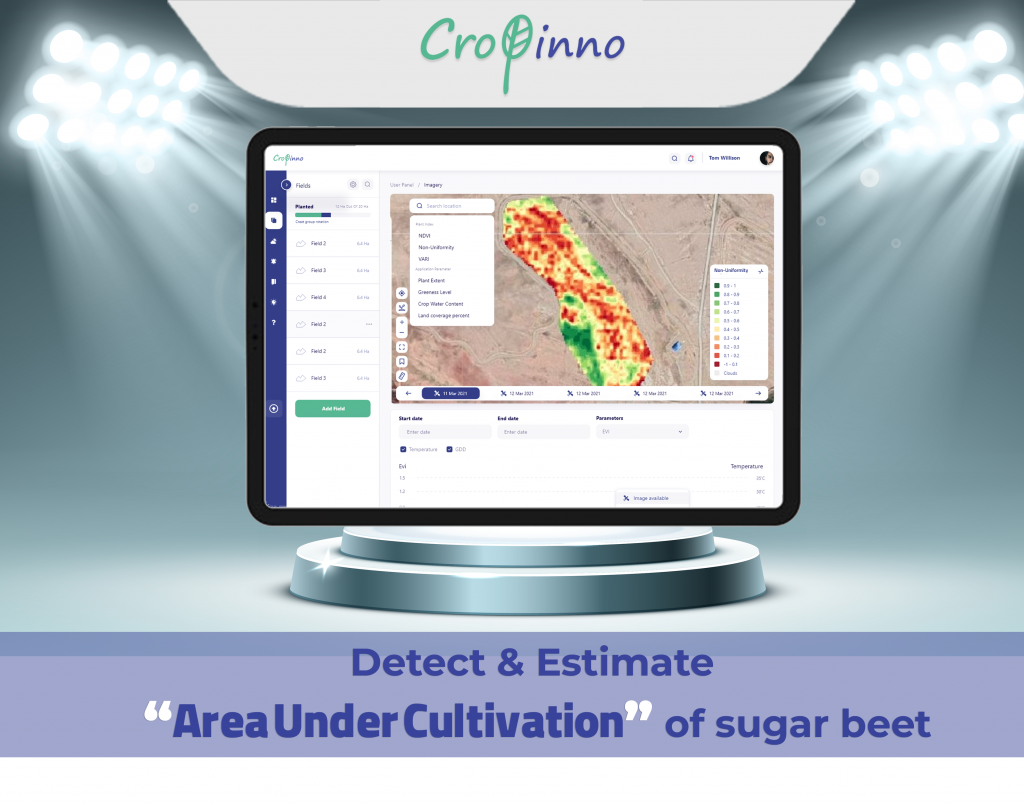
If you have ever used Cropinno to monitor your farm, you are probably familiar with various vegetation indices, including the NDVI, and you know that the main application of the NDVI is to examine crop growth over a period of time and compare growth levels in different time stages. Now, with the efforts of experts and developers in our team, a new “non-uniformity” index has been added to our services, which can be used to take a closer look at crop growth at a specific time. Using this index, any vegetation non-uniformity throughout the field can be more easily and accurately detected. Non-uniformity detection allows you to compare the condition of plants in different zones of the field, regardless of what stage of growth they are in. Based on that, you can pick variable amounts of irrigation or fertilizer and inputs for different parts of the field. Finally, you can lead your whole farm to more uniformity & better overall yield.
How to use this new feature
Since one of the most important parameters in the early stages of growth is the plant growth rate, so a farmer usually has to visit his farm in short periods of time to check the growth rate condition of his crop. This is often a problem for large fields; Because with ground monitoring, it is not possible to check and analyze the exact condition of each crop zone throughout the field. Using the new non-uniformity detection maps in our software, in addition to detecting the growth stage of field plants, the current state of plants in their current growth stage can be compared with each other. By using this new functionality, it is possible to understand that at the current stage of growth, how the plants are growing in comparison to each other and the non-uniformities over the field will be easily recognized by the farmer.
One of the major differences between the non-uniformity detection index and our previous plant growth index (NDVI) is that plant growth index depends on growth stage and time; This means that with NDVI, the change in color spectra of the satellite images occurs due to different stages of growth and in contrast, the difference in the condition of the plants is less obvious; But in the non-uniformity index, the plant-to-plant uniformity can be better monitored at a specific growth stage.
Monitoring plant status in its early stages of growth
In the early stages of growth, the plant is relatively small and it’s not quite successful to understand the range of changes from the color spectrum on the plant growth map. What distinguishes the new non-uniformity detection map as a great feature is that it examines the condition of the plant in more detail at this critical stage, and the differences of plant early growth are shown more clearly in this map. As a result, non-uniformity maps allow farmers to have more control over their crop in the early stages of growth and to make their early critical decisions more accurately. In a practical example: You observe the non-uniformity map of your field in the early stages, you find out that the lower part of the field is in a better growth situation than the central and upper parts, in which case you realize that actions such as irrigation or foliar spraying must be performed in only some parts of the land, resulting in a significant inputs cost reduction.
Farmer’s guide to correct & timely actions
The application of the non-uniformity detection index can be seen in some of the most sensitive field-level decisions. For example, this farm was in early stages of rapeseed growth, but the plants did not grow at the same level. In one part of the land, soil salinity caused the weed to absorb the soil nutrients and grow rapidly, and because the field plants were in the eight-leaf stage, it was not possible to use herbicides to control the weeds. Despite the recommendations of our support team about manual weeding, unfortunately, the delay in this action had exacerbated the non-uniformity and caused the crop to not grow uniformly in different parts of the land. During the subsequent studies of non-uniformity maps of this land, the exact area under weed stress was identified and the farmer was then again advised to first do manual weeding in the exact area, then use urea fertilizer, and after the zone reached the quality level of the rest of the field, apply diammonium phosphate fertilizer to grow rapeseed uniformly throughout the field.

You can find related content on our Instagram page
Feel free to contact us & ask any questions [here]

